When the application first launches, the main charting window appears along with the Control Panel. The Control Panel includes important settings and is used to configure the software and spectrum analyzer. The settings include:
Start / Stop Scan
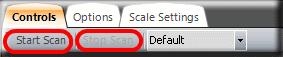
Pro Audio White Space Finder employs a wide-band RF spectrum analyzer that scans the frequency range specified by the user. Scanning is controlled by the 'Start Scan' and 'Stop Scan' buttons. Scanning repeats continuously until the 'Stop Scan' button is pressed. The frequency range that is scanned is defined by the 'Start' and 'End' frequency settings (see below).
Built-in Profiles
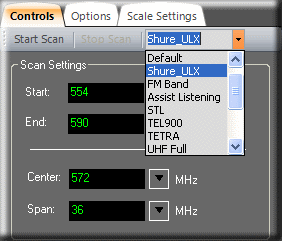
The Pro Audio White Space Finder application comes pre-configured with 'Built-in Profiles'. These profiles control many important parameters, including the following: Start and End frequencies, Region-Of-Interest (ROI), sensitivity, scaling, and the Monitored Frequencies settings. The application also supports 'User-defined Profiles'. When you select one of the built-in profiles from this drop-down list then those settings are immediately applied throughout the application and will be in effect the next time the 'Start Scan' button is pressed. In general, the built-in profiles use default settings and differ only in their Start and End frequencies.
As a side note, the built-in profiles can not be accessed while the analyzer is actively scanning. That is, if the analyzer is scanning and you wish to use a built-in profile then it is necessary to first press the 'Stop Scan' button.
Trace Only (mode)
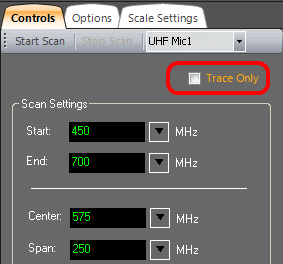
On those occasions when you only wish to capture spectrum traces and are not interested in performing intermodulation analysis, then you can save time by selecting the 'Trace Only' checkbox. When 'Trace Only' mode is selected then the Spectrum Trace view expands to full screen and the other diagnostic charts are not available. Also, Intermodulation Analysis is not available during 'Trace Only' mode.
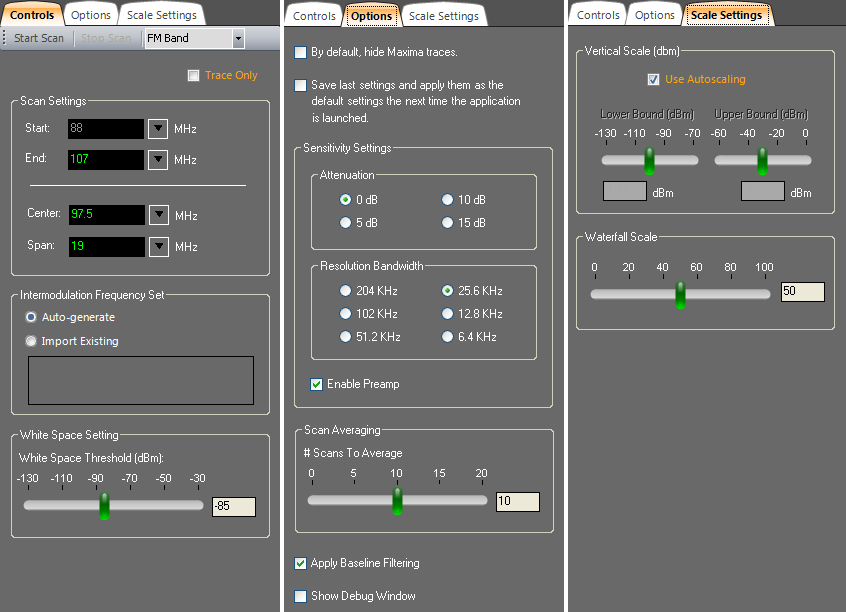
Scan Settings
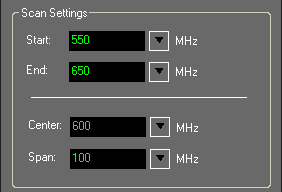
The most important parameters are the Start and End frequencies, which are set here. The Start and End frequencies can be set explicitly or implicitly, if you prefer, by setting the Center frequency and the Span. They are always specified in units of megahertz (MHz). Supported frequencies are 500 KHz through 4400 MHz.
As a side note, the scan settings can not be accessed while the analyzer is actively scanning. That is, if the analyzer is scanning and you wish to change the frequency range then it is necessary to first press the 'Stop Scan' button.
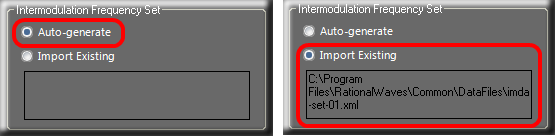
Intermodulation Frequency Set
Intermodulation interference is rarely desirable in wireless communication systems -- particularly in radio or audio processing. Furthermore, it is not something that is readily measurable and avoidable (e.g. using an RF spectrum analyzer). However, the physical basis for IMD is well understood and the mathematical formulas used to describe it are relatively simple -- so, computational methods can be applied to generate frequency sets that are free of intermodulation interference and which mitigate its effect. If you are interested in learning more details about intermodulation distortion there are many articles and references available on the Internet. For a good explanation we refer you to the following article: Intermodulation Performance and Measurement of Intermodulation Components.
A 'Frequency Set' is a set of computed frequencies that are related in a very important way -- they are intermodulation-compatible. That is, their intermodulation products do not interfere with the frequencies in the set. Pro Audio White Space Finder provides two ways for you to introduce a Frequency Set that will be applied for real-time intermodulation analysis -- 'Auto-generate' and 'Import Existing'.
Auto-generate: When the 'Start Scan' button is pressed then the application will compute a frequency set for the specified frequency range that tests for two-transmitter, 3rd-order intermodulation products (2Tx3rds). This takes only a few seconds and is performed prior to the first scan. With each scan the 'Whitespaces And Intermod-Compatible Frequencies' chart is updated. Taking into account both white space regions and the computed frequency set, the chart displays those channels that are both free of RF interference and intermodulation distortion. These are the channels you would then assign to your wireless transmitters.
Import Existing: If you have previously created a frequency set using Pro Audio White Space Finder or Intermod Assist and saved it in an XML-formated file, then you can import that file. In this case, the application takes into account the white space regions and the imported frequency set when computing the best channels. Again, with each scan, the 'Whitespaces And Intermod-Compatible Frequencies' chart is updated and displays those channels that are both free of RF interference and intermodulation distortion.
White Space Setting
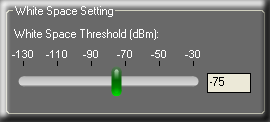
The 'White Space Threshold' slider controls the threshold signal strength (in dBm) below which is considered 'White Space'. When you adjust this control you'll also see the horizontal, white line in the Spectrum Trace view move up and down accordingly. Along those frequency spans where the white line is solid and not interrupted by a peak, then this would be considered a White Space region. It is completely up to the user as to what is an appropriate threshold for this control -- it depends greatly on the environment you are working in and what level of signal transmissions you feel can be safely ignored. Those frequencies whose signal strength amplitudes exceed the threshold are considered off-limits and are locked-out -- that is, they will not be considered as candidates for a frequency set.
The results from determining the White Space regions are used for locating open frequency space in crowded RF environments and applied to computing the best frequencies and spacing for setting-up multiple transmitters -- as shown in the 'Whitespaces And Intermod-Compatible Frequencies' view. This is most helpful when frequency coordination and RF interference are factors that need to be taken into consideration when selecting which frequencies or channels to assign to wireless transmitters.
By default, hide Maxima traces
Selecting this CheckBox causes the Maxima traces to be hidden by default in the Spectrum and Region-Of-Interest (ROI) Trace views. The Maxima traces can be re-enabled from the popup menu that is accessed by right-clicking on either the Spectrum or ROI Trace views.
Save last settings and apply them as the default settings the next time the application is launched
When this CheckBox is selected then the next time the application is launched it will remember your last settings and apply them to the new session.
Sensitivity Settings
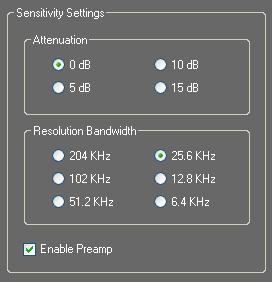
We recommend you leave the sensitivity settings at their default values: 0 dBm Attenuation, Resolution Bandwidth of 25.6 KHz and Preamp enabled.
Attenuation:
The internal electronic attenuator may be set to 0, 5, 10 or 15 dB. A Local Oscillator signal may be observed at the RF input port, often found 10.7 MHz above the RF frequency being scanned. Typically, this level will not interfere with your measurements. If you are connecting to an antenna and suspect LO feedthrough is a problem, then this can be mitigated by setting the attenuator to 15 dB. This will typically reduce your LO leakage to less than 2 nanowatts for all frequencies below 1 GHz -- but at the expense of sensitivity.
Resolution Bandwidth:
Resolution Bandwidth (RBW) controls the frequency resolution of the frequency axis -- that is, the smallest distance that can be resolved between two adjacent peaks. In FFT-based analyzers (such as the Signal Hound spectrum analyzer) the FFT and its associated windowing parameters determine the frequency resolution or resolution bandwidth. As you lower the RBW to improve frequency resolution the sweep time increases because the FFT spectrum analyzer is performing a longer data acquisition and larger FFT calculation.
Preamp:
A preamplifier was designed into the Signal Hound spectrum analyzer to reduce the displayed average noise level.
Scan Averaging
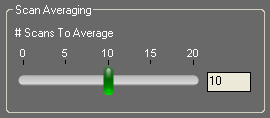
Scan averaging (also referred to as video averaging) accumulates and averages scans over time. RF signals can fluctuate quite a bit from one scan to another, and scan averaging helps to eliminate some of the noise and enhance the pattern of the true signals. One downside to using scan averaging is that in an unstable RF environment where signals are spontaneously appearing or disappearing, then these changes could be slow to appear in the diagnostic views. To disable scan averaging, set the number of scans to average to '0'.
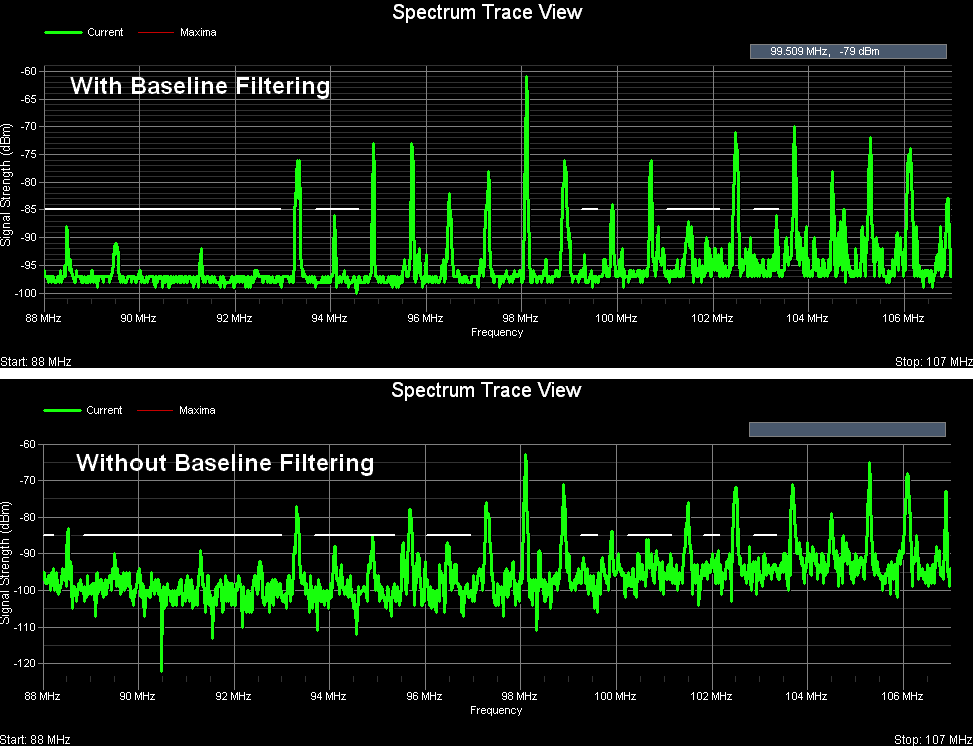
Baseline Filter

The raw data acquired during a spectrum scan can be very "spikey" -- making it difficult to identify a baseline for the spectrum trace. By default a baseline filtering algorithm (implemented in software) is applied to the raw data. Below are examples of traces with and without baseline filtering enabled.
Scale Settings
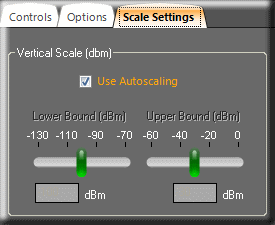
Two types of scaling can be applied to spectrum traces -- autoscaling (the default) and manual scaling. When autoscaling is selected then manual scaling is disabled. When manual scaling is used, the slider controls the lower and upper boundaries (in dBm) of the Spectrum, ROI, Topographic and White Spaces views. The auto and manual scaling controls can be used to "zoom" the trace views and enhance their clarity. This has no effect on data acquisition or intermodulation analysis -- only on how the data is displayed.
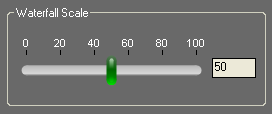
The 'Waterfall Scale' slider control applies only to the 'Waterfall History' view. This control can be used to rescale and remap the signal strengths to better spread them across the range of colors that are used (see legend to the right of the Waterfall History view). This is useful when all the signal strengths are large and the Waterfall view appears mostly red or when all the signal strengths are low and the Waterfall view appears mostly blue. For the best visual effect, ideally you'd like the peaks (strong signals) to appear red and the valleys (weak signals) to appear blue. But sometimes even the valleys have large signal strength values or the peaks have low signal strength values. This control is useful in remapping the color legend to better make use of the colors and how they are spread across the peaks and valleys of the signal strength values.