When the Touchstone application is launched the main charting window appears alongside the Control Panel. The Control Panel includes important settings and is used to configure the software and spectrum analyzer. The settings are organized under three tabs -- Controls, Options, and Scale Settings -- as shown below:
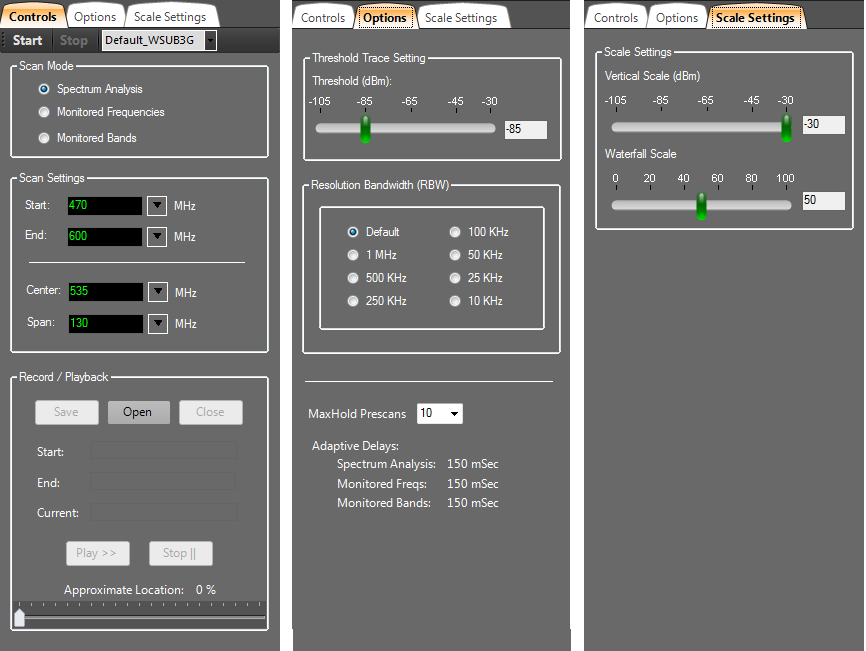
Start / Stop Scan
Touchstone employs a wide-band RF spectrum analyzer that scans a frequency range specified by the user. Scanning is controlled by the Start and Stop buttons. Scanning repeats continuously until the Stop button is pressed. The frequency range that is scanned is defined by the Scan Settings (see below).
Built-in Profiles
Touchstone comes pre-configured with Built-in Profiles. These profiles control certain parameters, such as the frequency range that is scanned. When you select one of the built-in profiles from the drop-down list then those settings are immediately applied throughout the application and will be in effect the next time the Start button is pressed. In general, the built-in profiles use default settings and differ only in their Start and End frequencies. The application also supports User-defined Profiles, which are described in more detail in the section Menu Options > User-Defined Profiles.
As a side note, you cannot change the profile currently in use while the analyzer is actively scanning. That is, if the analyzer is scanning and you wish to use a built-in profile then it is necessary to first press the Stop button.
Scan Mode (Touchstone pro-only)
The Scan Mode settings offer three options: Spectrum Analysis, Monitored Frequencies and Monitored Bands.
When set to Spectrum Analysis mode, Touchstone-Pro scans the specified frequency range and displays a spectrum trace -- that is, a chart with RF Signal Strength along the Y-axis and frequency along the X-axis. It also displays the data using a variety of diagnostic charts: Waterfall History, Topographic Map, Delta Chart, and Threshold Trace.
Using the Monitored Frequencies or Monitored Bands scan modes, Touchstone-Pro displays the RF energy detected at (up to) 160 specific frequencies or bands defined by the user. The Monitored Frequencies and Monitored Bands modes are similar in that they allow you to monitor specific frequencies or bands. For example, in the setting of a live performance where it is important to monitor the channels that have been assigned to wireless audio devices, the Monitored Frequencies feature can be used to ensure those channels are not being impacted by other sources of RF transmissions. Similarly, in a cell-phone free area, the Monitored Bands feature can be used to monitor the frequency bands used by cell phones for the purpose of detecting prohibited transmissions.
Scan Settings
The most important parameters are the Scan Settings, which are set here. The Start and End frequencies define the boundaries of the RF spectrum trace when the analyzer is scanning and measuring RF energy across a frequency range. These can be set directly or, if you prefer, indirectly by setting the Center frequency and the Span. The frequency settings are always specified in units of megahertz (MHz). Supported frequencies depend on which analyzer model is currently attached to the PC.
The scan settings can not be accessed or changed while the analyzer is actively scanning. That is, if the analyzer is scanning and you wish to change the frequency range, then it is necessary to first press the Stop button.
Record / Playback (Touchstone Pro-only)
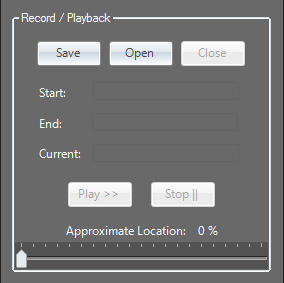
Touchstone-Pro allows you to record and playback scanning sessions. After recording for the desired time and the Stop Recording button pressed, the Save Recording button is then enabled. Pressing the Save Recording button allows you to save your most recent scanning session to a file. To play a previously recorded scan session, use the Open Recording button to select a saved recording and then press the Play Recording button.
Threshold Trace Setting (Touchstone Pro-only)
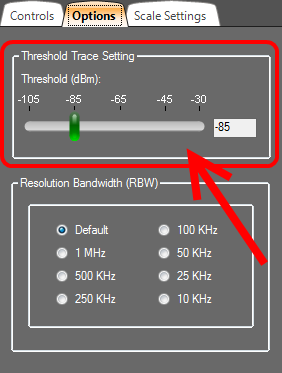
The Threshold Trace Setting is where you specify a threshold value that is applied to the Threshold Trace diagnostic chart. Frequencies whose signal strength exceeds this threshold will be highlighted with a yellow box.
Resolution Bandwidth
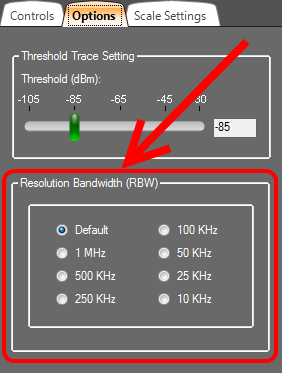
Touchstone provides a feature that allows some control over the resolution bandwidth (RBW) used during scanning. The resolution bandwidth determines the smallest frequency that can be resolved. The smaller the RBW the finer the resolution. Finer resolution requires a longer data acquisition time. When data acquisition time is a factor and a faster refresh time is desired, then a larger RBW can be used. RBW and data acquisition time are inversely related.
During scanning the current resolution bandwidth is displayed in the Spectrum Trace view (as shown below).

Scale Settings
The Vertical Scale slider controls the height of the Y-axis in the Spectrum Trace view. By default it is set to -30 dBm (the maximum value). If the signal strengths are low then decreasing the Vertical Scale has the effect of "zooming" the trace views. This has no effect on the data acquisition but, rather, simply how the data is displayed.
The Waterfall Scale slider control applies only to the Waterfall History view. This control can be used to rescale and remap the signal strengths to better spread them across the range of colors that are used (see legend to the right of the Waterfall History view). This is useful when all the signal strengths are large and the Waterfall view appears mostly red or when all the signal strengths are low and the Waterfall view appears mostly blue. For the best visual effect, ideally you'd like the peaks (strong signals) to appear red and the valleys (weak signals) to appear blue. But sometimes even the valleys have large signal strength values or the peaks have low signal strength values. This control is useful in remapping the color legend to better make use of the colors and how they are spread across the peaks and valleys of the signal strength values.