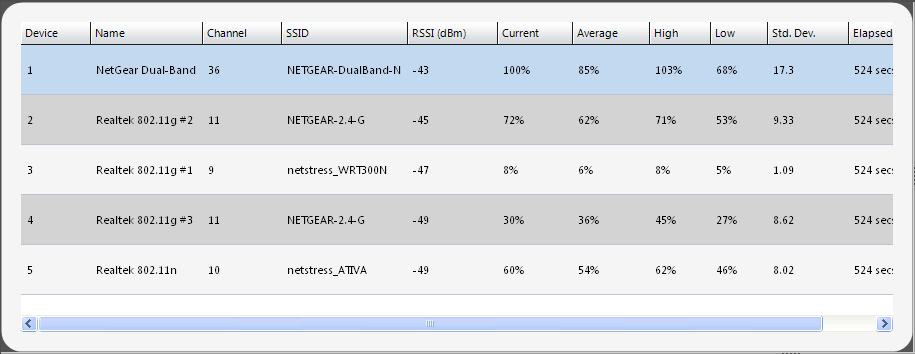
1. Adapter Statistics Grid
|
2. Adapter Heatmap / Waterfall Chart
|
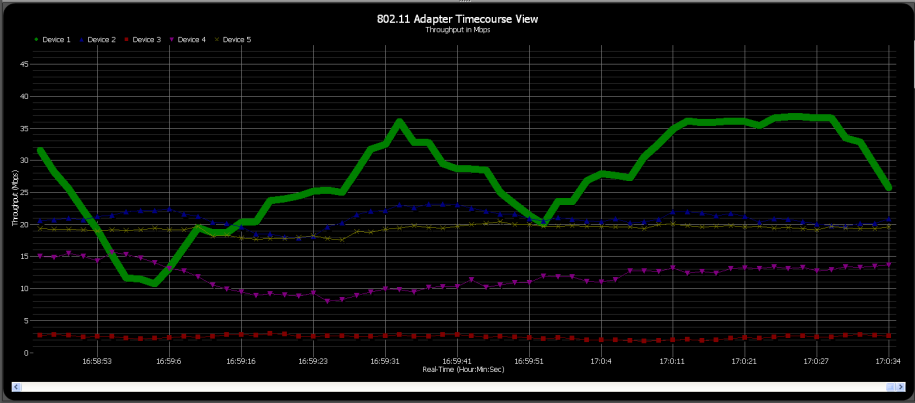
3. Adapter Timecourses Chart
|
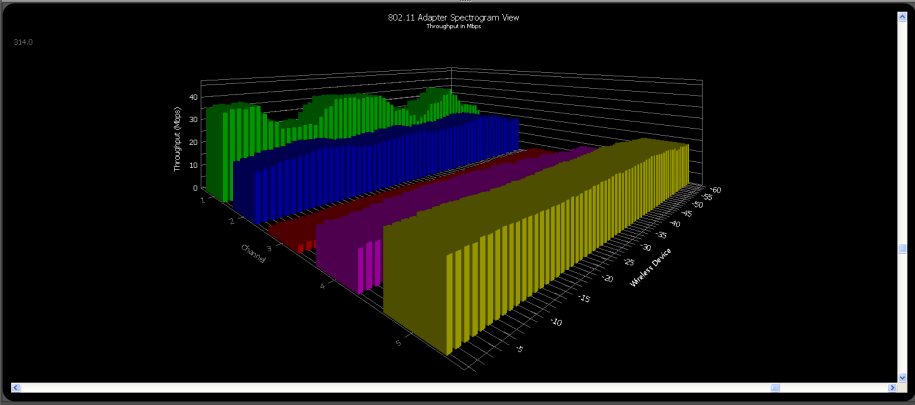
4. Adapter Spectrogram Chart
|
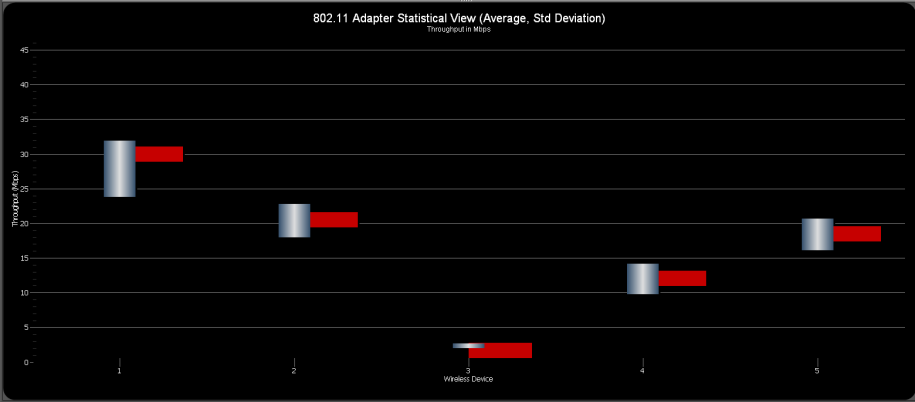
5. Adapter Statistics Chart (Average, Std. Deviation)
|
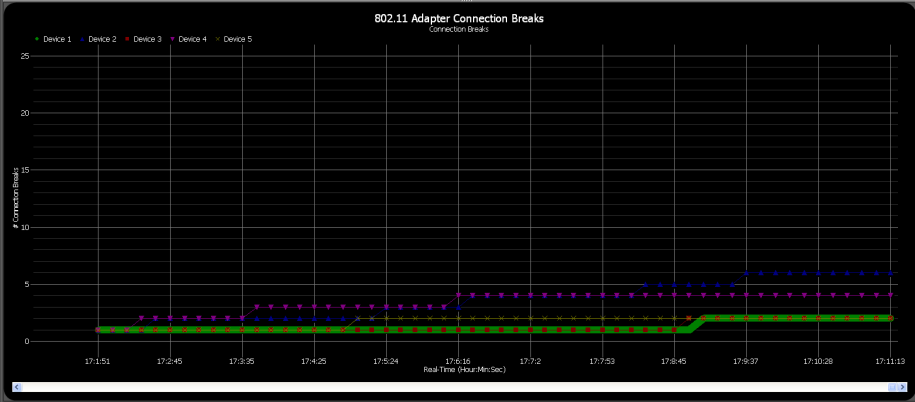
6. Adapter Connection Breaks
|
Below are sample screenshots from NetSurveyor-Pro. They are divided into two categories: 802.11 Connection Analysis and Network Discovery. The data acquired and analyzed for connection analysis uses all 802.11 adapters that are currently associated with an access point. The the data displayed for 802.11 network discovery (i.e. WiFi Scanning) also uses your built-in 802.11 wireless adapter -- if more than one 802.11 adapter is present then you will be presented a list to choose from.
The connection and adapter analysis module used by NetSurveyor-Pro measures the throughput performance of each 802.11 connection (i.e. adapter / access point pair). ICMP (Internet Control Message Protocol) messages, also known as "ping" messages, are used to exchange data between an adapter and access point (or another IP address on the wireless network). The application measures the rate of data transfer and reports the throughput in Mbps (megabits per second). This metric is sensitive to a variety of factors that typically affect 802.11 networks (e.g. RF and multipath interference, location of access point, antenna orientation, etc.) and, hence, reflects the current performance level of the wireless network. In addition, the application tracks the number of "dropped" messages and reports these as a temporary break in the connection. The number of dropped messages is a metric that reflects on the reliability of a network. Again -- throughput is used as a metric of performance and dropped messages as a metric of reliability. (NOTE: Some access points or wireless routers may rate-limit the handling of ICMP packets as a matter of policy or process them at a lower priority. If your hardware falls in this category then it may be necessary to temporarily disable that feature while using NetSurveyor-Pro.)
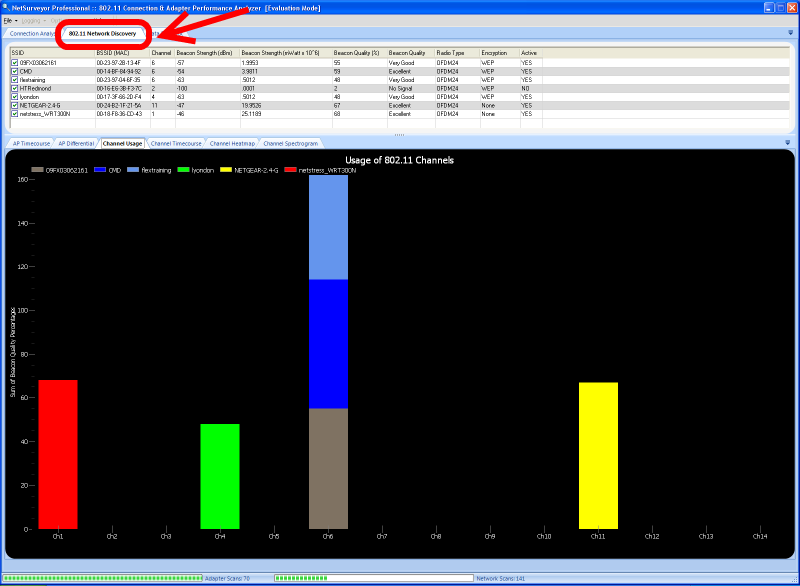
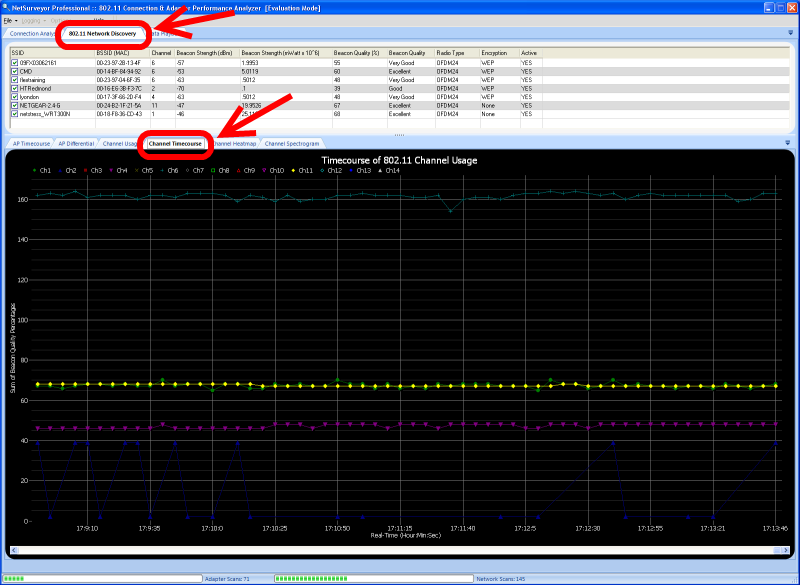
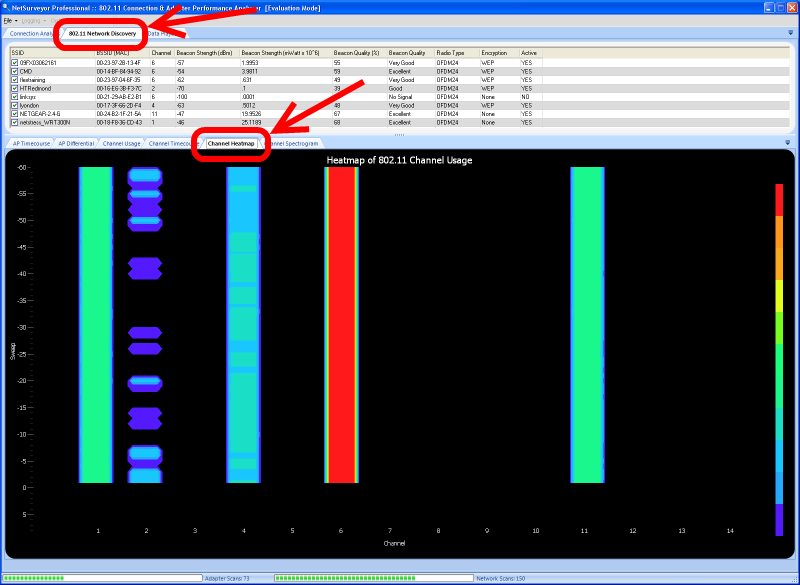
In 802.11 network discovery the 802.11 wireless adapter only sees 802.11 beacons -- it does not see raw RF energy or measure network or throughput performance. The charts created by the 802.11 network discovery module use only beacon strengths as reported by your 802.11 wireless adapter. The beacon strength simply reflects the physical location of the corresponding access point relative to the client station (i.e. 802.11 adapter). The closer the access point to the client station, then the stronger the beacon strength. This is somewhat of an over-simplification, but the important point is that beacon strength is not a measure of performance.
Connection and Adapter Analysis
1. Adapter Statistics Grid
|
2. Adapter Heatmap / Waterfall Chart
|
3. Adapter Timecourses Chart
|
4. Adapter Spectrogram Chart
|
5. Adapter Statistics Chart (Average, Std. Deviation)
|
6. Adapter Connection Breaks
|
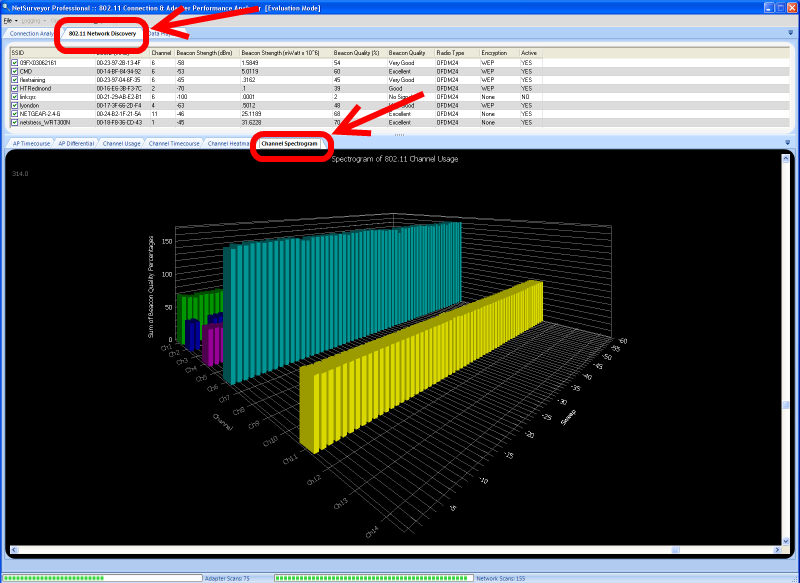
802.11 Network Discovery
1. Grid of Access Points and BSSIDs
|
2. Timecourse of Beacon Qualities For Each Access Point
|
3. Differential Display of Beacon Qualities For Each Access Point
|
4. Usage of Each of the 802.11 b/g Channels
|
5. Timecourse of the Usage of Each of the 802.11 b/g Channels
|
6. Heatmap / Waterfall Chart of the 802.11 b/g Channels
|
7. Channel Spectrogram of the 802.11 b/g Channels
|
Copyright © 2009, Nuts About Nets, LLC