When the Clear Waves application is launched the main charting window appears alongside the Control Panel. The Control Panel includes important settings and is used to configure the software and spectrum analyzer. The settings are organized under two tabs -- Controls and Options -- as shown below:
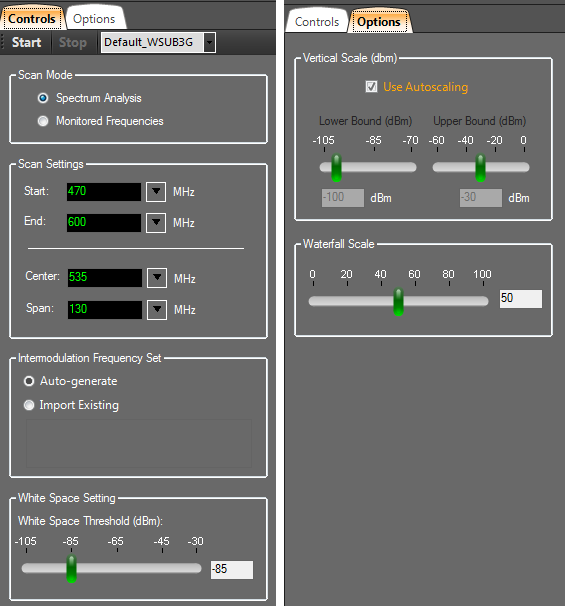
Start / Stop Scan
Clear Waves employs a wide-band RF spectrum analyzer that scans a frequency range specified by the user. Scanning is controlled by the Start and Stop buttons. Scanning repeats continuously until the Stop button is pressed. The frequency range that is scanned is defined by the Scan Settings (see below).
Built-in Profiles
Clear Waves comes pre-configured with Built-in Profiles. These profiles control certain parameters, such as the frequency range that is scanned. When you select one of the built-in profiles from the drop-down list then those settings are immediately applied throughout the application and will be in effect the next time the Start button is pressed. In general, the built-in profiles use default settings and differ only in their Start and End frequencies. The application also supports User-defined Profiles, which are described in more detail in the section Menu Options > User-Defined Profiles.
As a side note, you cannot change the profile currently in use while the analyzer is actively scanning. That is, if the analyzer is scanning and you wish to use a built-in profile then it is necessary to first press the Stop button.
Scan Mode
The Scan Mode settings offer two options: Spectrum Analysis and Monitored Frequencies.
When set to Spectrum Analysis mode, Clear Waves scans the specified frequency range and displays a spectrum trace -- that is, a chart with RF Signal Strength along the Y-axis and frequency along the X-axis. It also displays the data using a variety of diagnostic charts: Waterfall History, Topographic Map, Delta Chart, and Intermods & Whitespace. The Intermods & Whitespace chart, in addtion to displaying the RF spectrum trace, presents a visual representation of an intermodulation-compatible frequency set.
Using the Monitored Frequencies scan mode, Clear Waves displays the RF energy detected at (up to) 160 specific frequencies defined by the user. For example, in the setting of a live performance where it is important to monitor the channels that have been assigned to wireless audio devices, the Monitored Frequencies feature can be used to ensure those channels are not being impacted by other sources of RF transmissions.
Scan Settings
The most important parameters are the Scan Settings, which are set here. The Start and End frequencies define the boundaries of the RF spectrum trace when the analyzer is scanning and measuring RF energy across a frequency range. These can be set directly or, if you prefer, indirectly by setting the Center frequency and the Span. The frequency settings are always specified in units of megahertz (MHz). Supported frequencies depend on which analyzer model is currently attached to the PC.
The scan settings can not be accessed or changed while the analyzer is actively scanning. That is, if the analyzer is scanning and you wish to change the frequency range, then it is necessary to first press the Stop button.
Intermodulation Frequency Set
Intermodulation distortion (IMD) is rarely desirable in radio or audio processing, as it creates unwanted spurious emissions, often in the form of sidebands. Furthermore, it is not something that is readily measurable and avoidable (e.g. using an RF spectrum analyzer). However, the physical basis for IMD is well understood and the mathematical formulas used to describe it are relatively simple -- so, computational methods can be applied to generate frequency sets that are free of intermodulation distortion and which mitigate its effect. If you are interested in learning more details about intermodulation distortion there are many articles and references available on the Internet. For a good explanation we refer you to the following article: Intermodulation Performance and Measurement of Intermodulation Components.
A 'Frequency Set' is a set of computed frequencies that are related in a very important way -- they are intermodulation-compatible. That is, their intermodulation products do not interfere with any of the other frequencies in the set. Clear Waves provides two ways for you to introduce a 'Frequency Set' that will be applied for real-time intermodulation analysis -- Auto-generate and Import Existing.
Auto-generate: When the Start button is pressed, the application will compute a frequency set for the specified frequency range that tests for two-transmitter, 3rd-order intermodulation products (2Tx3rds). This takes only a few seconds and is performed prior to the first scan. With each scan the Intermods & Whitespaces chart is updated. Taking into account both white space regions and the computed frequency set, the chart displays those channels that are both free of RF interference and intermodulation distortion. These are the channels you would then assign to your wireless transmitters.
Import Existing: If you have previously created a frequency set using Clear Waves or Intermod Assist and saved it in an XML-formated file, then you can import that file. In this case, the application takes into account the white space regions and the imported frequency set when computing the best channels. Again, with each scan, the Intermods & Whitespaces chart is updated and displays those channels that are both free of RF interference and intermodulation distortion.
White Space Setting
The White Space Threshold slider controls the threshold signal strength (in dBm) below which is considered White Space, i.e. frequencies which the program will treat as available for channel assignment and free of RF interference. When you adjust this control you'll also see the horizontal, white line in the Spectrum Trace view move up and down accordingly. Along those frequency spans where the white line is solid and not interrupted by a peak, then this would be considered a White Space region. It is up to the user to select an appropriate threshold -- it depends greatly on the environment you are working in and what level of signal transmissions you feel can be safely ignored. Those frequencies whose signal strength amplitudes exceed the threshold are considered off-limits and are locked-out -- that is, they will not be considered as candidates for a frequency set.
The results from determining the White Space regions are used for locating open frequency space in crowded RF environments and applied to computing the best frequencies and spacing for setting-up multiple transmitters -- as shown in the Intermods & Whitespaces view. This is most helpful when frequency coordination and RF interference are factors that need to be taken into consideration when selecting which frequencies or channels to assign to wireless transmitters.
Vertical Scale
The Vertical Scale control allows for two types of vertical scaling to be applied to spectrum traces -- autoscaling (the default) or manual scaling. The vertical scale refers to the Y-axis whose units are Signal Strength (dBm). When autoscaling is selected then Clear Waves will automatically adjust the vertical scale for you. When manual scaling is used then this setting controls the lower and upper boundaries (in dBm) of the Spectrum, Topographic and White Space charts. If the signal strength measurements are low then using autoscaling has the effect of enhancing the trace views. Scaling has no effect on data acquisition or intermodulation analysis -- only on how the data is displayed.
Waterfall Scale
The Waterfall Scale control applies only to the 'Waterfall History' view. This control can be used to rescale and remap signal strengths to better spread them across the range of colors that are used (see color legend to the right of the Waterfall History view). This is useful when all the signal strengths are large and the Waterfall view appears mostly red or when all the signal strengths are low and the Waterfall view appears mostly blue. For the best visual effect, ideally you'd like the peaks (strong signals) to appear red and the valleys (weak signals) to appear blue. But sometimes even the valleys have large signal strength values or the peaks have low signal strength values. This control is useful in remapping the color legend to better make use of the colors and how they are spread across the peaks and valleys of the signal strength values.