Overview of Diagnostic Charts
Below are sample screenshots from WifiEagle. They are divided into two categories: 802.11 Channel Analysis and Network Discovery. The data acquired and analyzed for channel analysis uses the wireless device that was shipped with the WifiEagle product, while the data displayed for 802.11 network discovery (i.e. Wi-Fi Scanning) uses your built-in 802.11 wireless adapter.
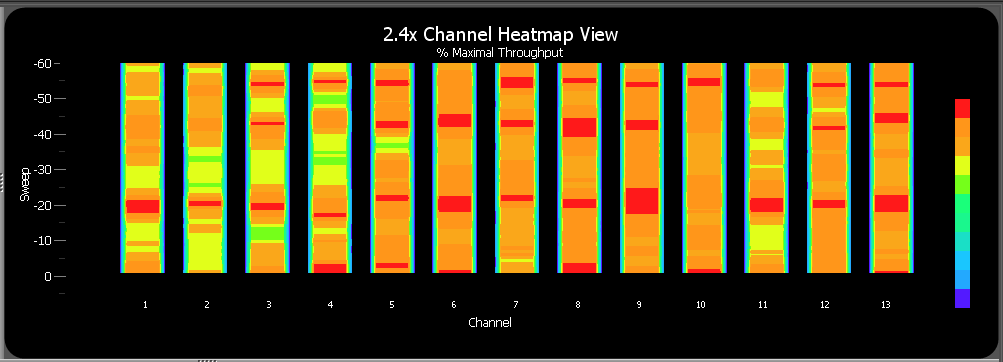
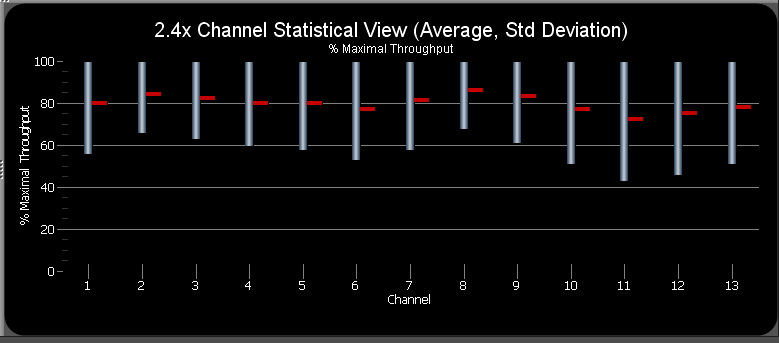
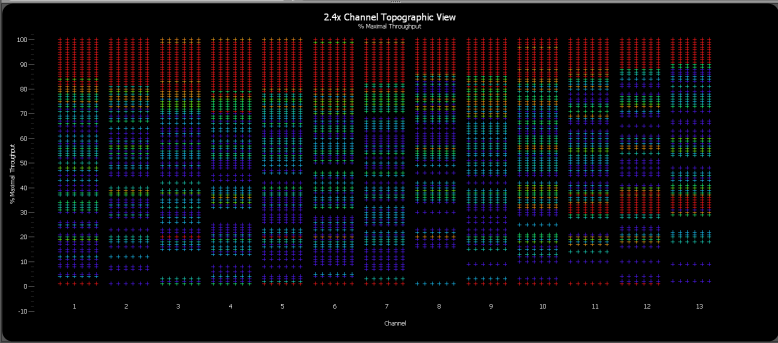
The channel analysis module used by WifiEagle employs IMMI technology to measure the throughput performance of each 802.11 channel and compares that with a reference. A result is calculated for each channel and the performance metric is presented in terms of '% Maximal Throughput'. A value of 100% implies the throughput performance of the channel is its expected maximum -- anything less than 100% suggests that throughput performance has been degraded to some degree, most likely due to RF interference from other wireless devices (either 802.11 or non-802.11).
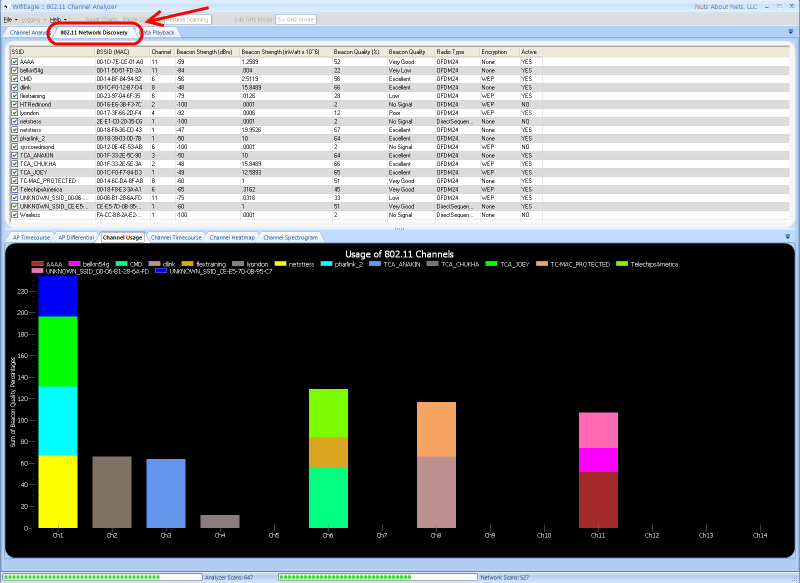
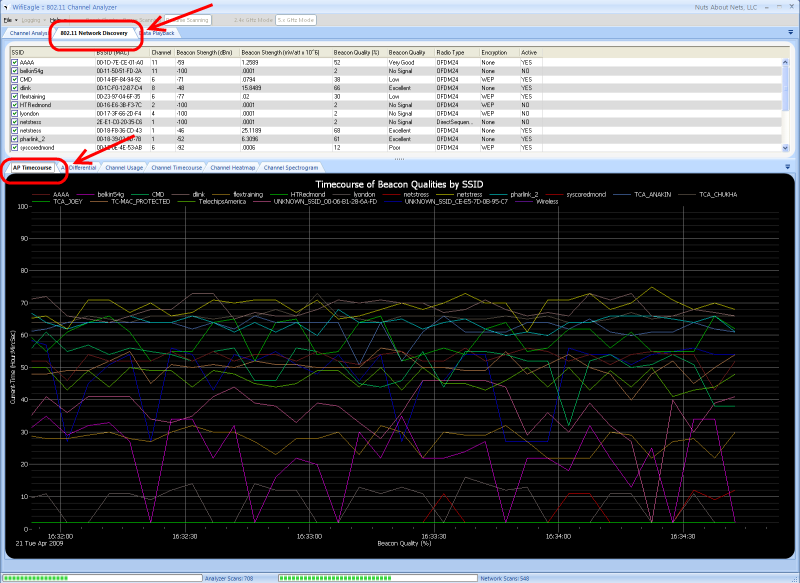
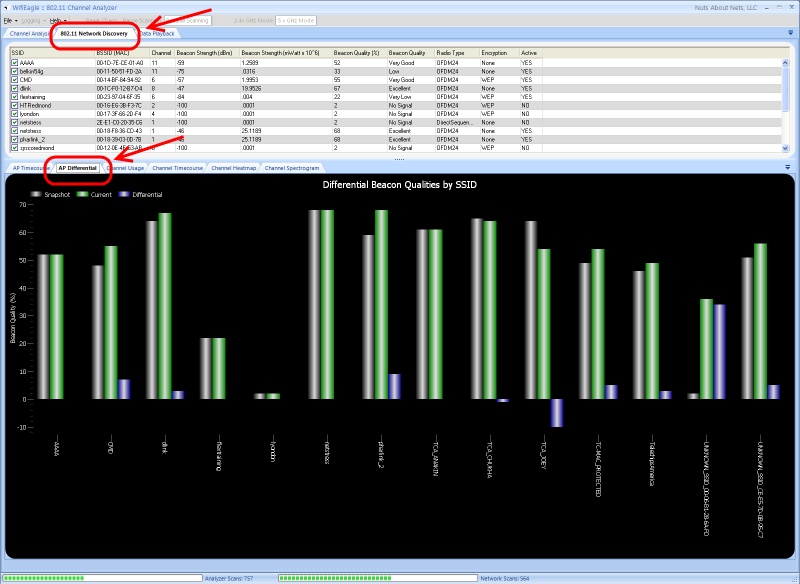
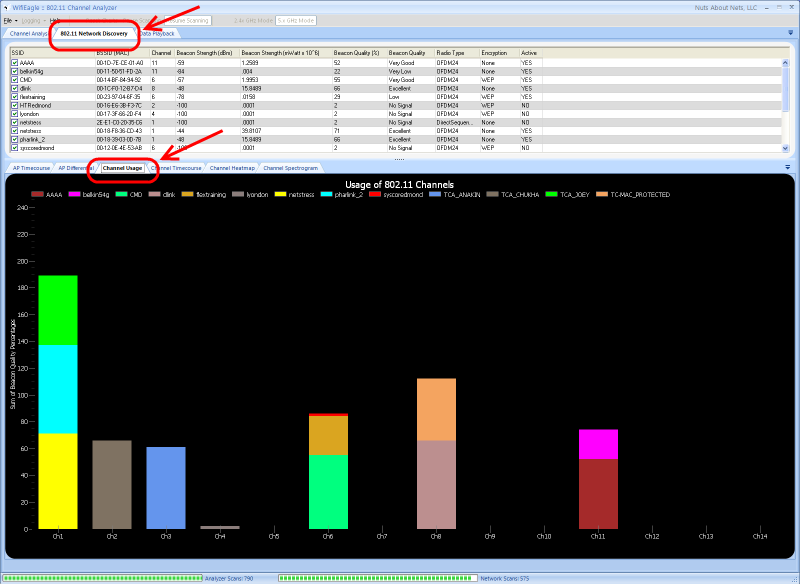
In 802.11 network discovery the 802.11 wireless adapter only sees 802.11 beacons -- it does not see raw RF energy or measure network or throughput performance. The charts created by the 802.11 network discovery module use only beacon strengths as reported by your 802.11 wireless adapter. The beacon strength simply reflects the physical location of the corresponding access point relative to the client station. The closer the access point to the client station, then the stronger the beacon strength. This is somewhat of an over-simplification, but the important point is that beacon strength is not a measure of performance.
Channel Analysis
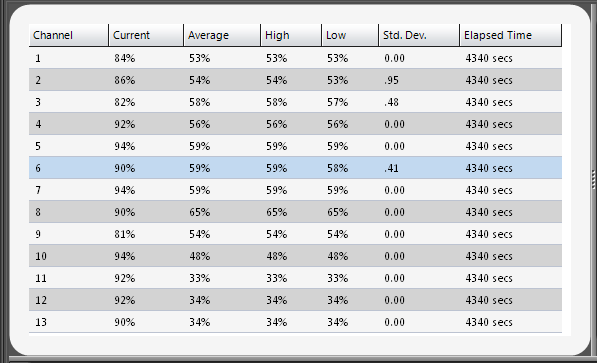
1. Statistical Grid
|
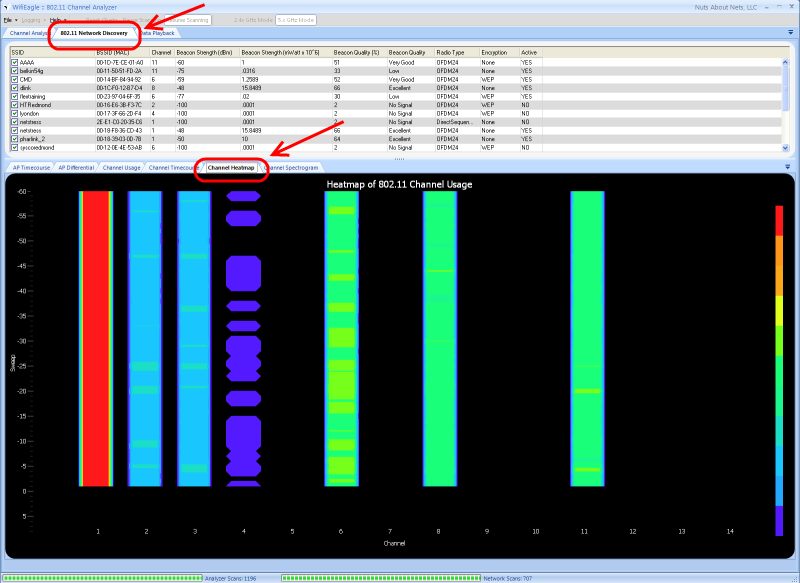
2. Channel Heatmap / Waterfall Timecourse Chart
|
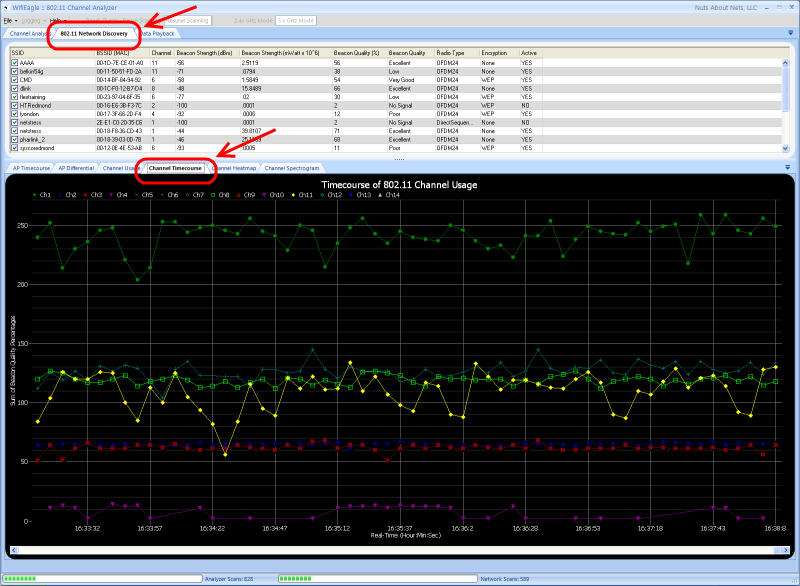
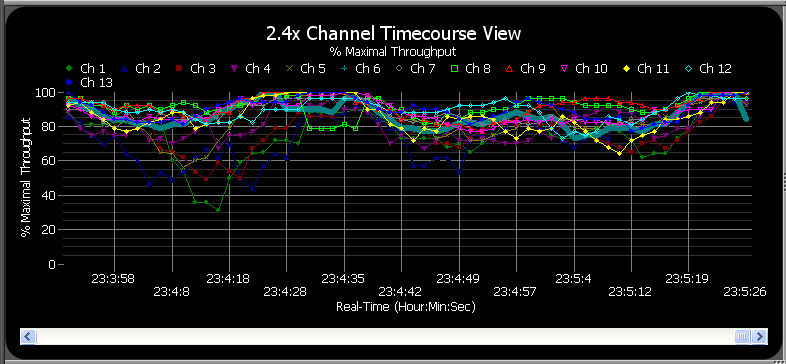
3. Channel Timecourses Chart
|
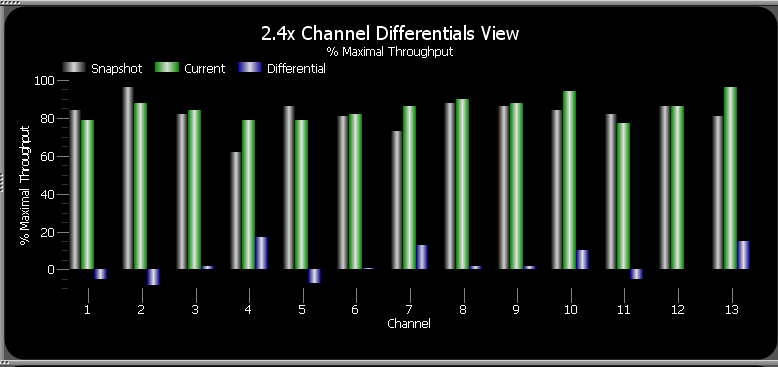
4. Differential Channel Chart
|
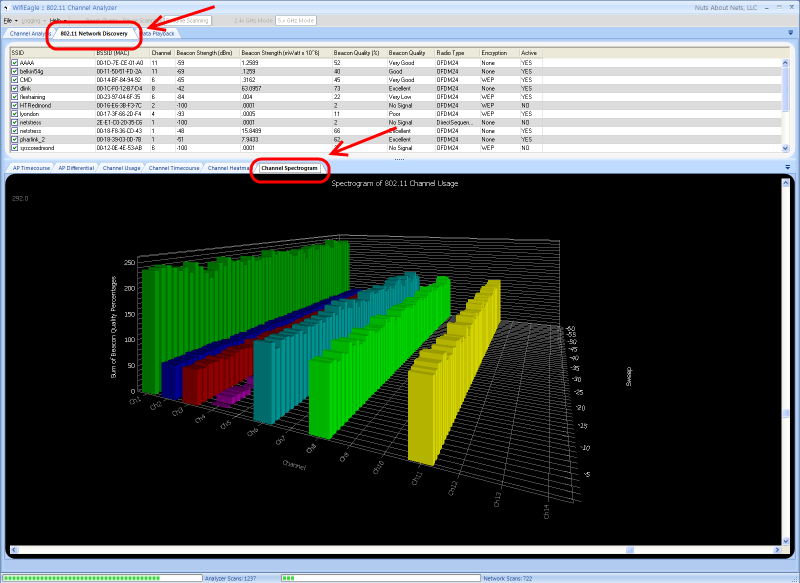
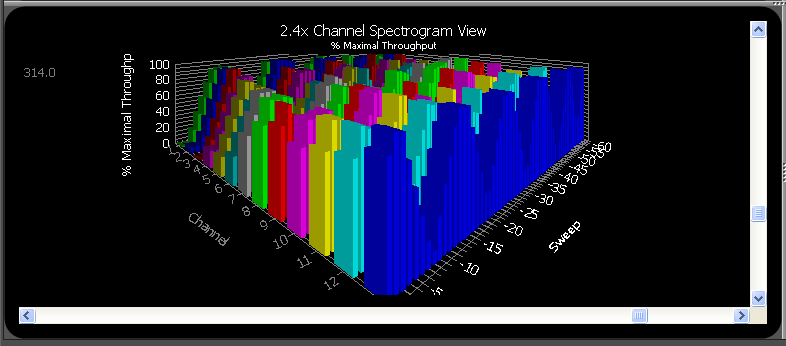
5. Channel Spectrogram Chart
|
6. Channel Statistics Chart (Average, Std. Deviation)
|
7. Topographic Channel Chart
|
802.11 Network Discovery
Copyright © 2009, Nuts About Nets, LLC