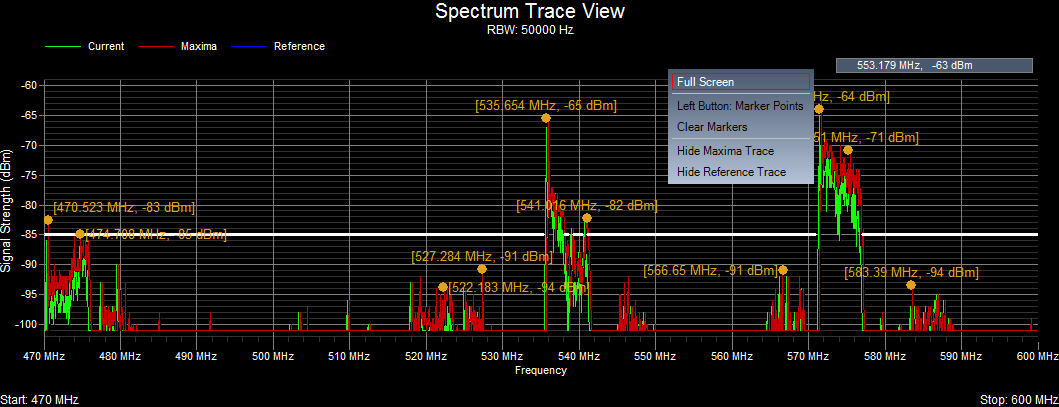
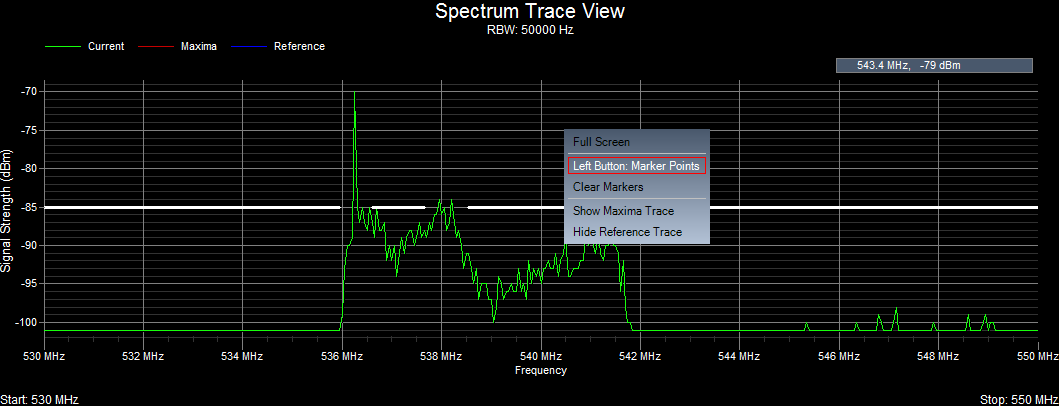
Popup menus are associated with several charts and are displayed by right-clicking on the chart. They provide access to additional features, as described below.

The popup menu associated with the Spectrum Trace view supports the following features:
Full Screen:
When you select this option from the popup menu then the Spectrum Trace view will enlarge and fill the entire screen and the two lower display windows will become minimized. To restore the Spectrum Trace view to its original dimensions, again access the popup menu by right-clicking the mouse and this time select Restore Screen.
Left Button: Marker Points:
When you select this option from the popup menu, subsequent left-clicks create Marker Points or "Hot Spots" that display the corresponding frequency (in MHz) and signal strength (in dBm) for the location in the grid that you just clicked.
Clear Markers:
If the Spectrum Trace view becomes too cluttered with Markers, they can be removed from the display by selecting Clear Markers from the popup menu.
Hide Maxima Trace:
When you select one of these options from the popup menu, the Maxima trace is no longer displayed. If the Maxima trace is currently hidden and you wish to display it again, then from the popup menu select Show Maxima Trace and it will once again be included in the view.


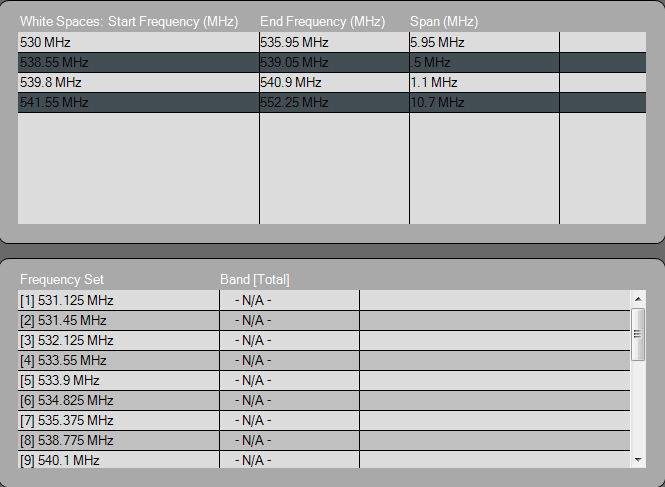
The popup menu associated with the White Spaces And Intermod-Compatible Frequencies view supports the following feature:
More Info: When you select More Info, a few tables similar to the ones below appear, which display a listing of the white space regions and the frequency set computed using the last scan.
